Training Schedule
Training for Infrared and EMT professionals world-wide.

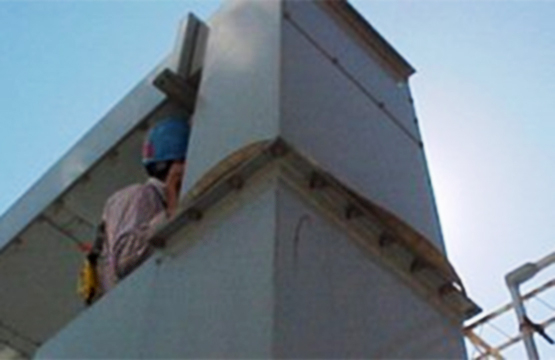
The visual image above is a duct off a transformer showing no visual indication of heat related failure.
Using thermal imaging to determine both the source, cause and severity of a hot spot isn’t always easy. Just because you see a thermal anomaly doesn’t necessarily mean you have located the source of the abnormal heating. In most all cases, thermographers are only detecting heating that has by some method of heat transfer, conduction, convection or radiation, migrated to an area where they have direct line of sight.
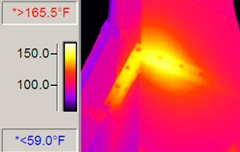
In the case of high resistance connections, even on small electrical circuits, thermographers should understand they are only observing the surface of the outside of the connector or conductor and that any heat being generated is coming from inside at the point of contact. The temperature difference between the source (i.e. the actual fault) and these surfaces have a thermal gradient. In most instances, heating at the fault is far more severe than what is appearing at the surface suggesting the potential presence of a large thermal gradient.
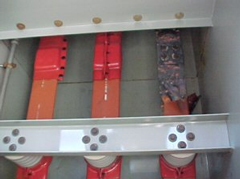
When inspecting components with large thermal gradients, such as enclosed electrical bus or any oil-filled device (including circuit breakers or transformers), carefully look for very subtle differences in temperature by narrowing your span, to increase the thermal contrast and appropriately adjusting the level of your image. Any anomalies detected using this method on this type of equipment may be an indication of a potentially critical internal problem.


