Training Schedule
Training for Infrared and EMT professionals world-wide.

In part one we discussed some of the common measurement parameters that change our apparent temperature measurement in our thermal images, whether we change them on the camera or in the software. In part two we learned different methods to report temperatures, or visually illustrate anomalies, with tools that are available in the OEM software designed to aid in image interpretation and reporting. In our final installment, we’re going to look at some slightly more advanced tools that a thermographer may have at their disposal.
In many applications, qualitative analysis is utilized for the purposes of reporting anomalous conditions. In buildings inspections we’re concerned with where insulation is damaged, inadequate, or not performing correctly. In roof inspections we’re attempting to locate trapped moisture based on differences in the thermal figurations present on the roof surface. In condition-based monitoring applications, qualitative analysis is still valuable, but there may be an expectation or need for reporting of temperature values. For some assets, temperatures might be trended over time to help determine when potential or functional failure might be imminent.
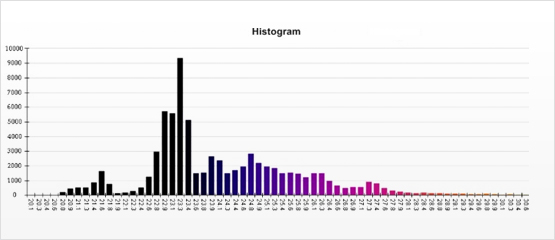
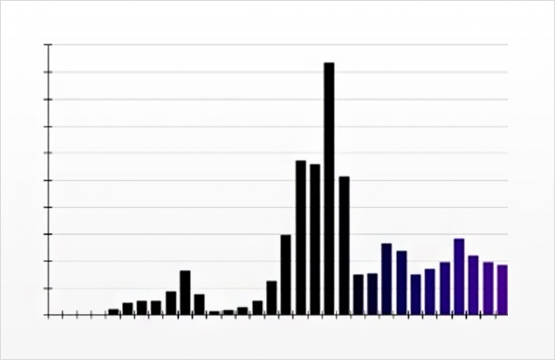
Histograms: One of the tools that can be considered for presenting quantitative temperature data is the histogram. A histogram is merely a graphical representation of numeric data. When applied to a thermogram, it’s a representation of temperature data displayed in the image. Some software allows the analyst to obtain the histogram distribution for a specified area instead of the entire image. Many people confuse histograms with bar graphs, because they somewhat resemble one another. Simply put, bar graphs compare variables, whereas histograms show how often a variable occurs. In thermal imaging, histograms distribute the individual pixels of thermal data into graphical format by temperature. In many common applications for thermography, the use of a histogram is more advanced than is necessary. For trending thermal data over time or studying heat transfer characteristics for a specific system however, histograms can be a powerful tool.
Relative Humidity/Distance to Target: These two measurement tools are mentioned together because they work hand in hand on their impact on temperature measurement. Atmospheric air is partially transmissive to IR radiation in both the mid-wave and long-wave spectra. As distance between the imager and the target increases, the signal is diminished by the attenuation inherent in the air. The correction factors of relative humidity and distance to target attempt to correct for that attenuation.
When conducting an inspection, you should consider which display options you want to see while in the field. Some of these options include image only display, image and scale, and display all. Many people typically use the display all option because with that option selected they can look at the LCD screen on the camera and see how the measurement parameters are set. But, just like palette choice, this is personal preference.
Because any adjustment to any of the measurement parameters will result in changes to your temperature measurements, it’s important to know what they do and when to adjust them. Measurement tools can help us identify and quantify anomalies in various ways. Learning what the measurement tools and parameters do for you and how they will affect your data is a must for thermographers. These topics are discussed in our Level I training and discussed in depth through hands-on experiments in our Level II course.


